

Open Source Omicron Pandemic Model for YOUR COUNTRY
Open Source Omicron Pandemic Model for YOUR COUNTRY
Predict future hospitalizations and deaths with your assumptions

I created a computer pandemic model designed specifically for Omicron. You — yes you — can copy this spreadsheet, set your assumptions for your country, and post your predictions online. You will become a guru of pandemic modeling in your country.
Click here to see the spreadsheet. When you open it, make your window as wide as you can, to see all three graphs.
https://docs.google.com/spreadsheets/d/12pQvumbVTR6f3LfthMdr4M75JfNRSFLN1TdZ_8dIaNQ/edit?usp=sharingLICENSE: You can copy, share, modify, and publicly post these spreadsheets. There is NO FEE. However, you MUST provide a link to my substack:
https://igorchudov.substack.com/
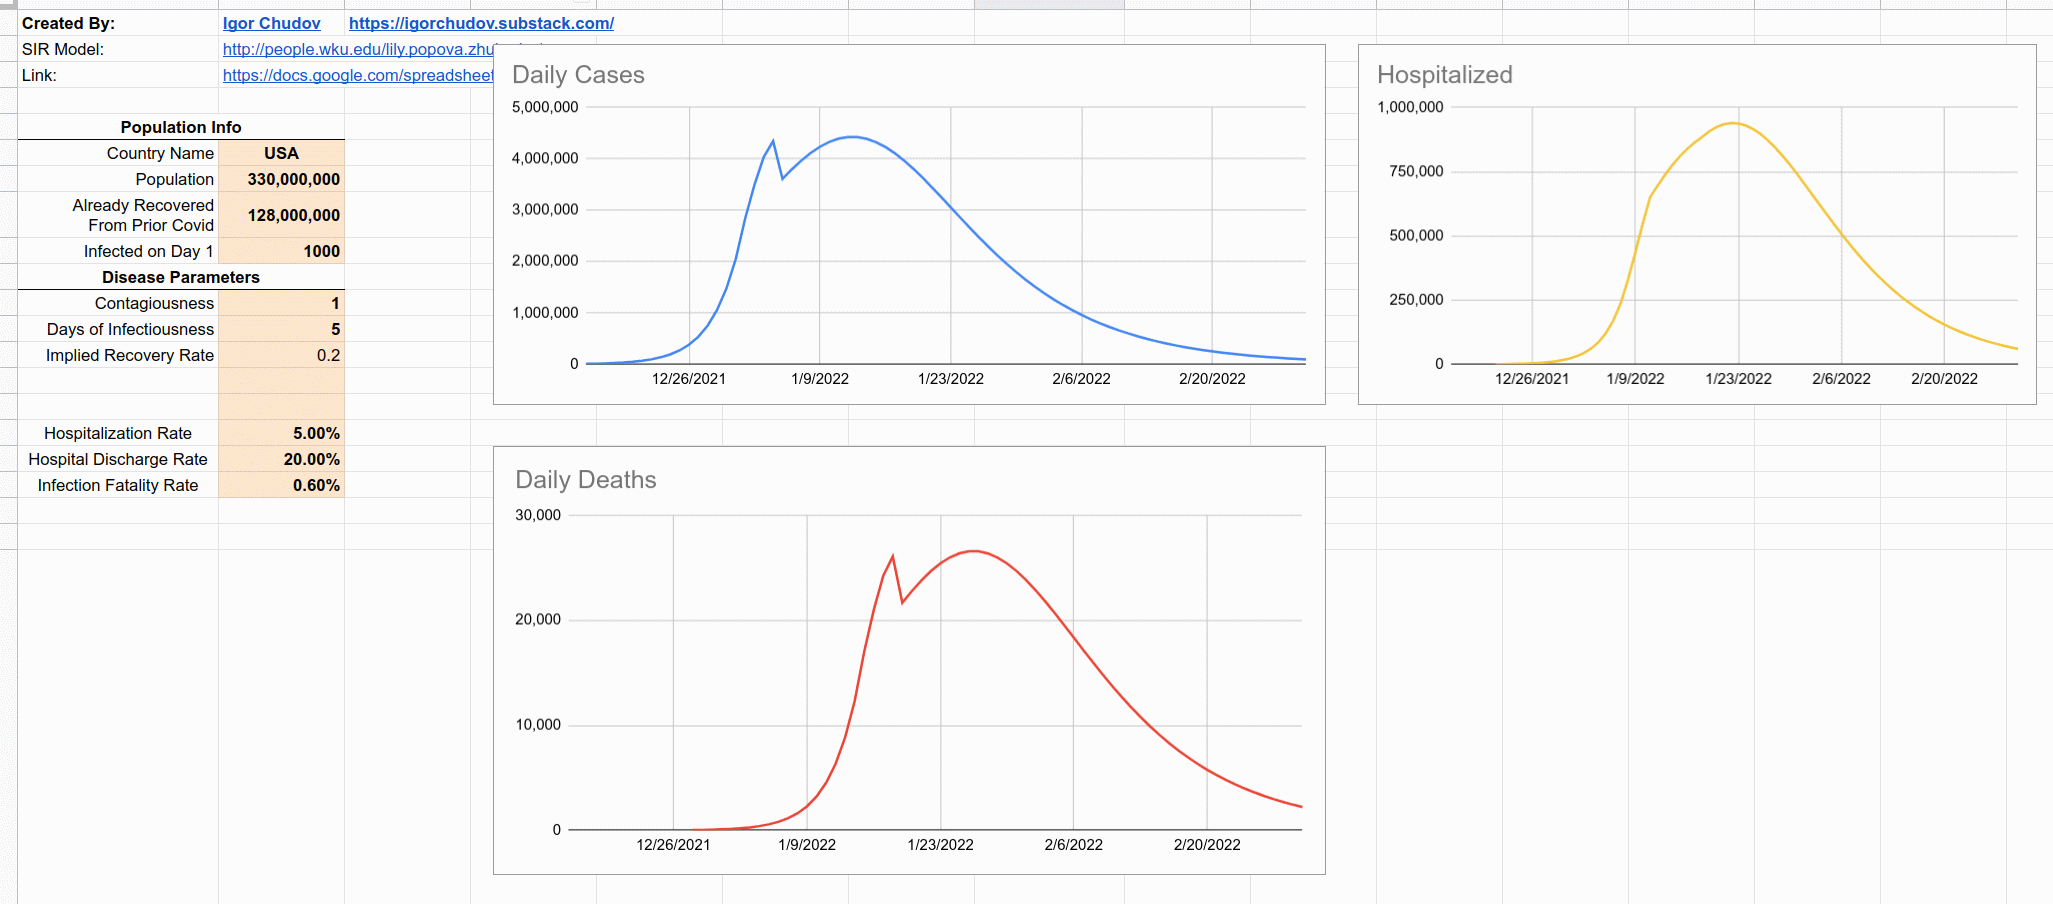
Example: (my example guess for USA — the assumptions are all guesstimates except for population and recovereds)
How to use this model:
Copy this spreadsheet to your own Google Doc so you can modify it
Duplicate one of the sheets and rename it for your country
The only things that are meant to be changed are beige colored
Now start changing assumptions:
Country Name: Your Country
Population: Enter population
Already recovered from prior Covid: Enter how many already Covid recovered you have in your country already, based on Worldometer data (it has data for every country). These people are assumed to NOT be infectable. You can disagree with this and change your spreadsheet, but it will make it much more complicated.
Contagiousness: enter a factor that matches speed of initial spread in your country. Number of 1 seems to work well to match existing data
Days of Infectiousness is incubation period, when people are contagious
Do NOT touch “implied recovery rate”, it is 1/(incubation period)
Hospitalization rate: how many cases end up being hospitalized
Infection Fatality Rate: how many cases end up dying
Mitigation factor simulates “Public Health Measures”
There is only ONE column in the model that you can modify: it is the “Mitigation Factor”. This factor represents reduction in infectiousness from measures such as lockdowns, making people wear respirators, social distancing, Covid concentration camps, welding apartment doors shut, and so on.
You can change this factor for any day in the period, in accordance with how you expect public policy to react. For example, if you think that in two weeks a major lockdown will start and will last four weeks, change the mitigation factor for each of these rows matching those 4 weeks, to be the factor you expect, for example 0.6 or whatever, depending how severe the measures will be.
This will cause everything to be recalculated and the graphs to be redrawn.
Major assumptions
Lag between cases and hospitalizations is one week
Lag between cases and deaths is two weeks
Covid recovered people are assumed to NOT be infectable
How it works
This spreadsheet is based on the “SIR model” — modeling Susceptible, Infectious, and Recovered. It is slightly modified to include “dead”, whom I subtract from “recovered”.
The SIR model us a standard model by epidemiologists to model the course of an epidemic. Its result is a so called “epidemic curve”. It assumes that infectious people infect the susceptible, who as a result become infected, and later recover. I added deaths to this model so that people either “recover” or “die” and the dead would reduce the number of remaining recovereds.
It does not model real life fully, for example it does not model mutations (changes in contagiousness), does not model hospitals running out of room, etc. It also does not model “vaccination”, because I want to keep it simple and vaccination does not seem to work against Omicron very well.
USA Numbers in this article
The numbers I used for USA, for hospitalization and death rates, are totally arbitrary. I put them in just to show you the spreadsheet. They are NOT my prediction for the USA.
Tomorrow
Tomorrow I am going to write a hard hitting piece modeling the USA and painting a dire, but realistic picture. You can play with the assumptions and show a different prediction. Time will tell who is right.
If you create a model for your own country, it may become seriously viral and make a lot of people think about stuff. You — yes you — might become even more famous than you are now.
I'm an attorney not a statistician. But ... Isn't computer modeling to predict hospitalizations and deaths how we got into this hysteria in the first place? I'm looking at you, Neil Ferguson.
It was exactly a spreadsheet like this that led to my awakening in April 2020. Every week I would also list the numbers found on Worldometer and for many countries, the figures seemed to line up. But as I live in Japan I also tracked Japan's figures, and lo and behold, they didn't add up. So I started to question the whole narrative.